Agencies can combine the power of Tablet Command, ESRI’s Survey 123 and ArcGIS Online to quickly collect and display geospatial data. These powerful collaborative tools can be used for a wide variety of situations including damage assessments, marking hazardous occupancies, and identifying safe zones and lookouts during wildland pre-incident planning.
To get started using Survey 123 and with Tablet Command you will need the following:
- Access to an organizational ArcGIS online account with Creator permissions and license for Survey 123 or the Field Apps Bundle. You can see this by looking at you user profile.
- A list of data you would like to collect other than location. This can include drop downs, radio buttons, free-form text, and images among other options.
- An established Named User account associated with Tablet Command through our web console.
To illustrate the process we will show you how to create a damage assessment survey using the online web designer tool, share it to users in the field and display the data in Tablet Command. Start by going to https://survey123.arcgis.com and logging in.
Create New Survey
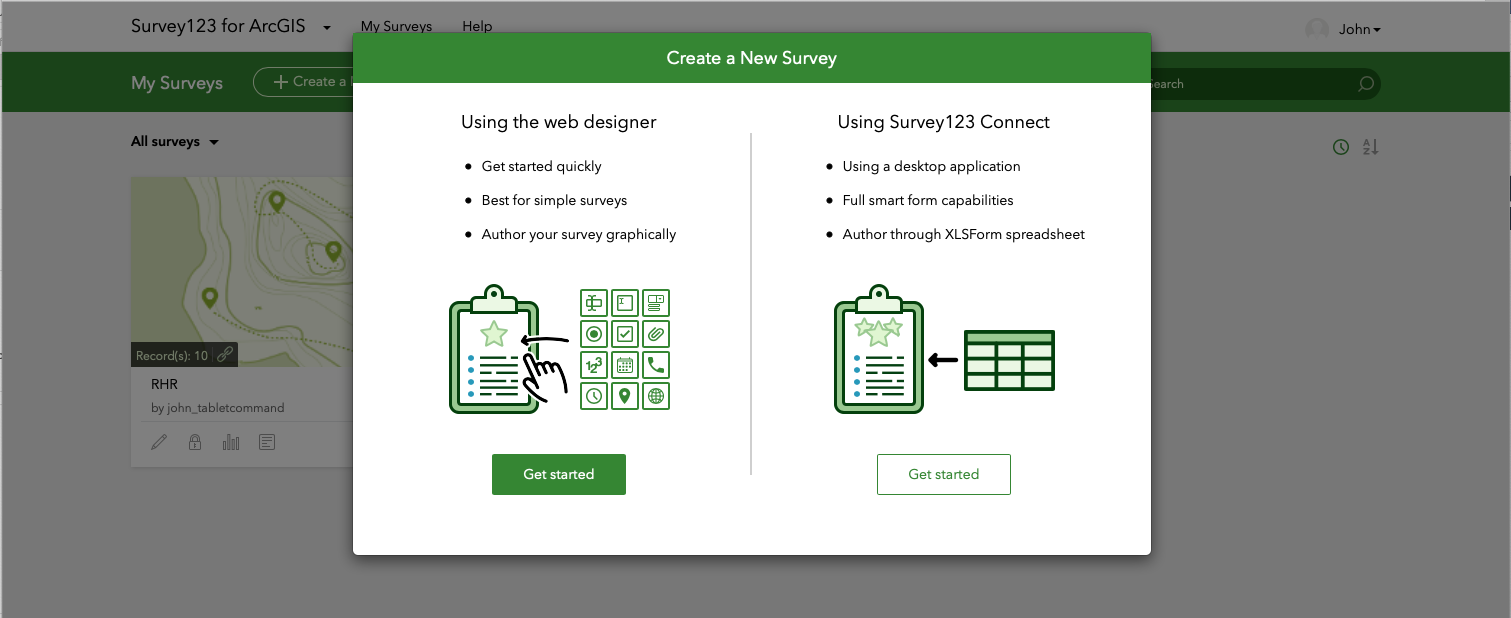
Click on Create a New Survey and choose "Get Started" under the Web Designer option.
Add Questions
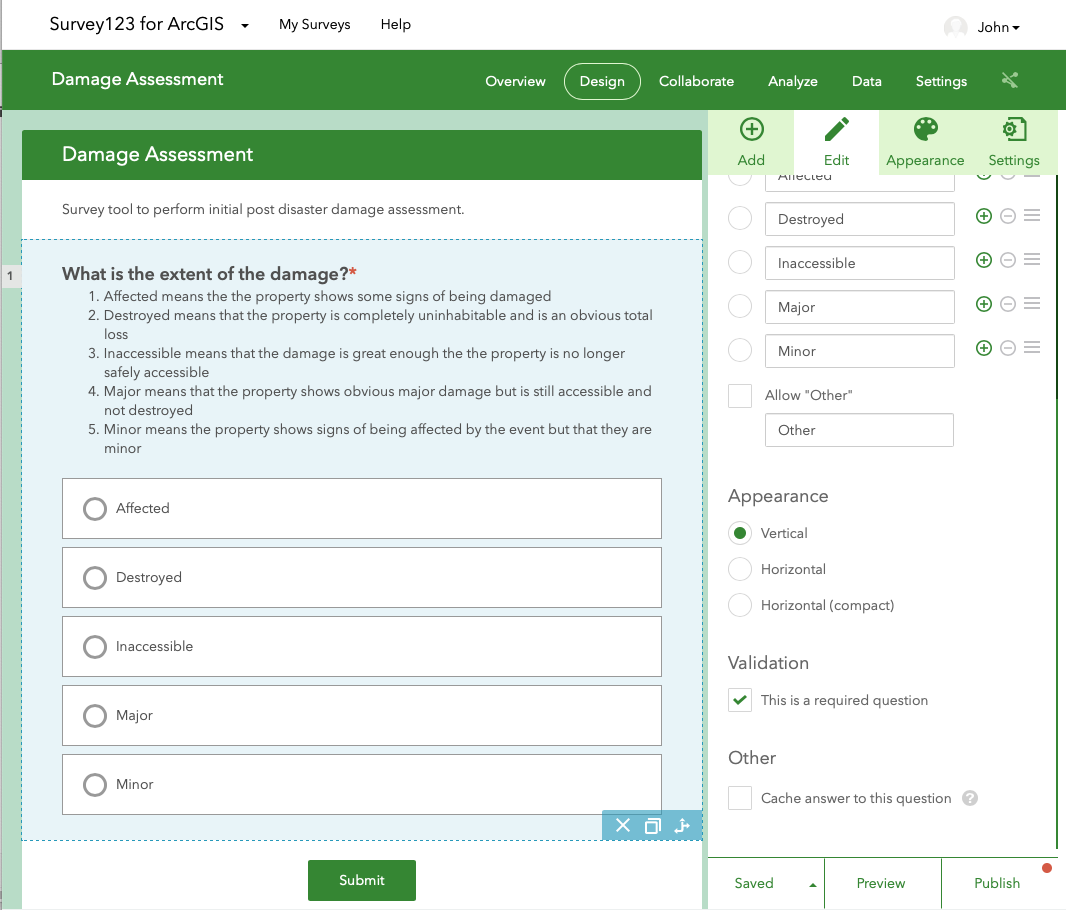
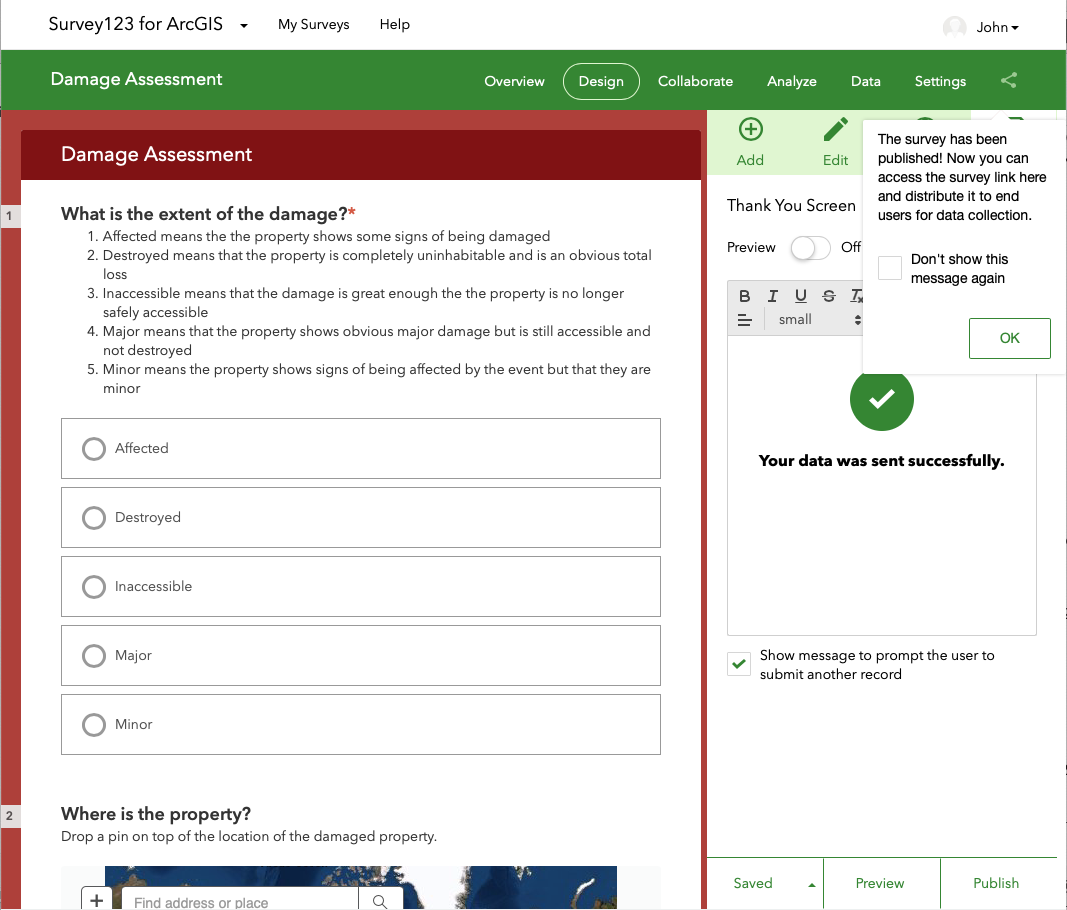
Now you can start building your survey by adding questions. For the damage assessment we used the "Single Choice" option. The Label was the question, "What is the extent of the damage?", the Hint is the directions, and the allowed choices were defined. For this survey, this is one of the required questions.
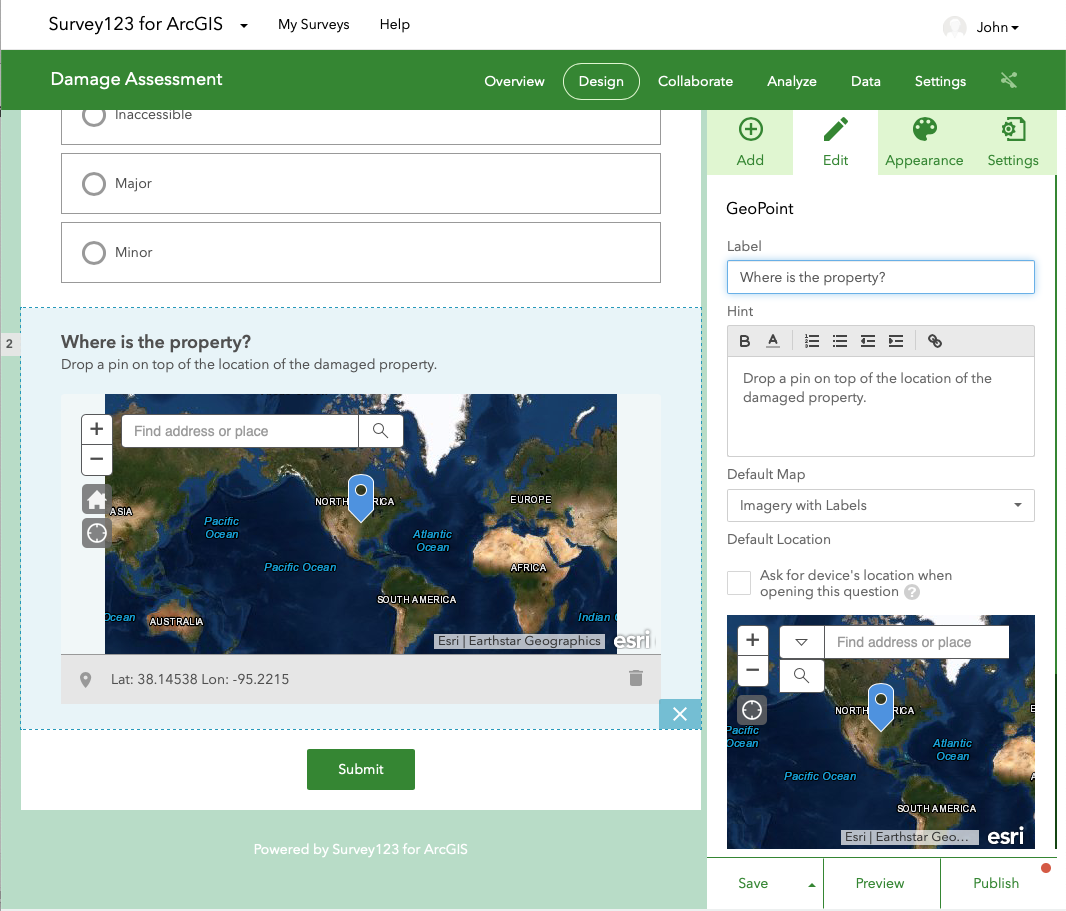
Next we added a GeoPoint feature to note the location the property. One of the nice features of Survey 123 is that the location can be set by centering on your location, AND by manipulating the map directly for fine tuning. This also means that if you cannot access the location you want to mark, you can still place its location accurately on the map.
Finish Adding Questions, Preview and Publish
After that we added the option to add a picture and a comment to the survey. In our case, the two required options were the extent of damage and the location of the property. Once these were added we used the preview tool to see how the survey would look on the a phone, tablet or web browser, tweaked the color scheme using the "Appearance" tab, and published the survey by clicking the "Publish" button at the lower right.
You can edit a published survey, but users in the field will not receive a prompt that it has changed and will need to update the survey by downloading it to their device again. Therefore, we recommend that once a survey has been shared to users in the field that no changes are made.
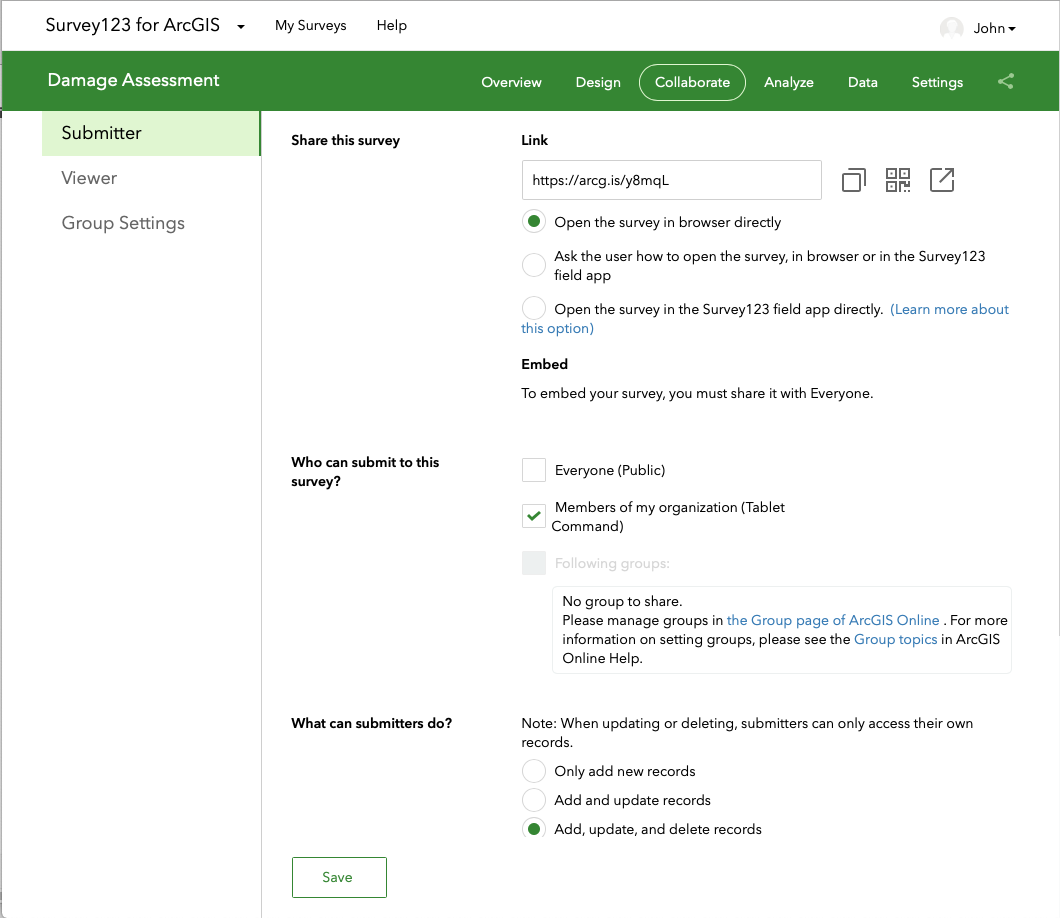
Set permissions and share survey
Now that your survey is published you can share it with others in your organization, share it with a group, or make it public using the tools on the Collaborate tab. In our case we made the survey only available in our organization. When you choose this option users logged into the Survey 123 app on their phone or tablet will be able to download the survey to their device, and web users will have to log into the appropriate organizational ESRI account to access the survey.
You can share the web link directly with team members or you can post a QR code into an IAP, on a bulletin board, wherever appropriate for your style of survey.
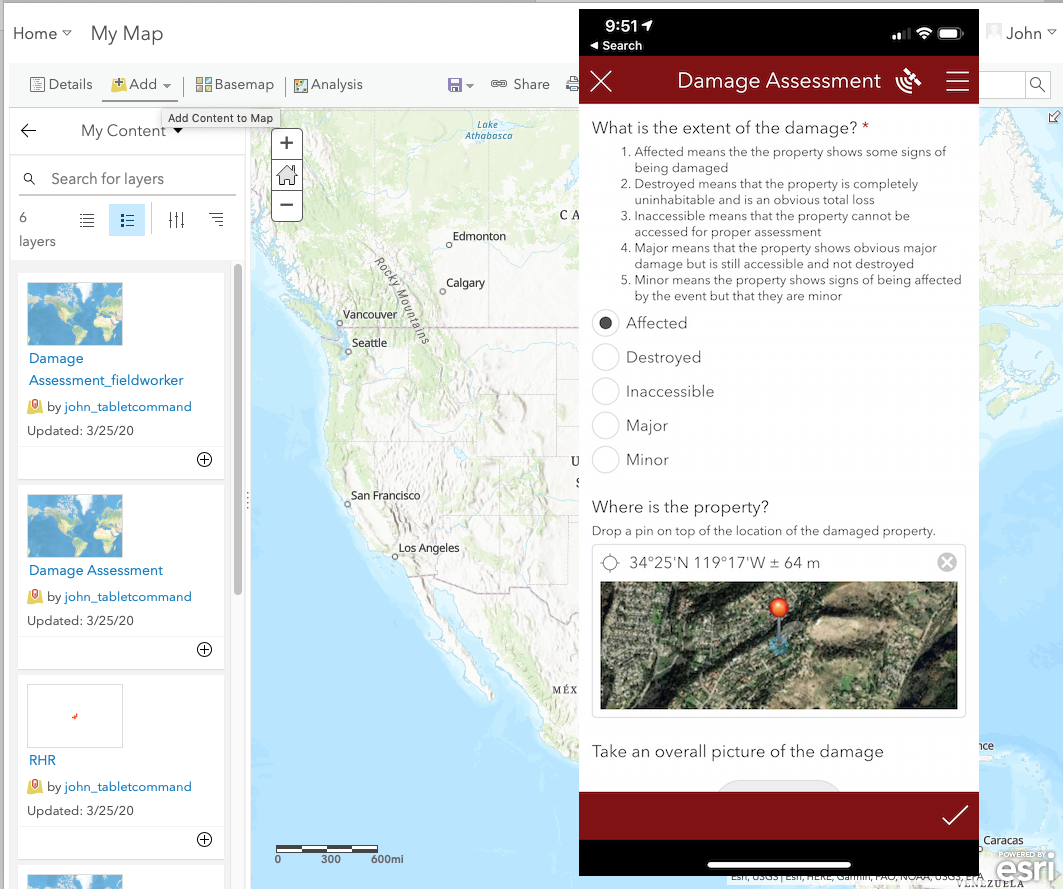
Collect Data
Users can now collect data from the field or by marking locations on the map and answering the appropriate questions. The data will be added to a ArcGIS feature layer which can be added to a new or existing web map.
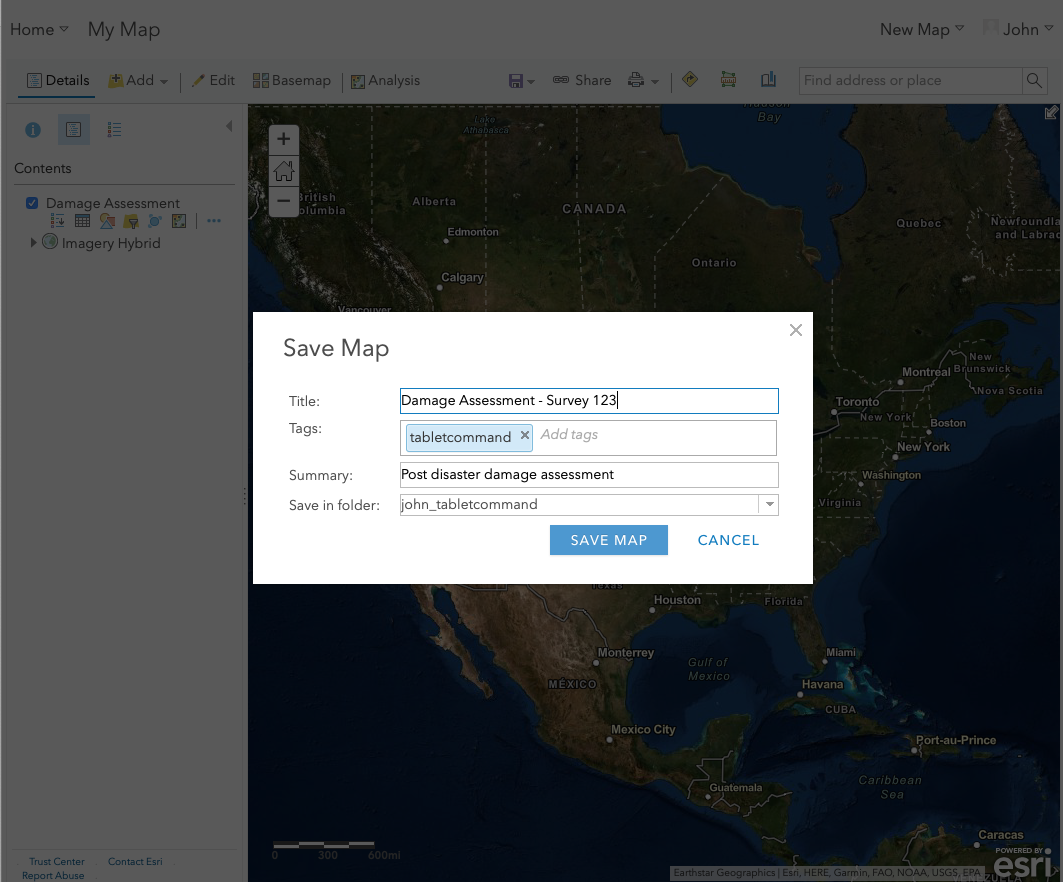
Add to an agol web map
Add the feature layer created by the survey you created to a new or existing web map is part of the account attached to your Tablet Command account. The survey points and answers to the the questions will then become visible in Tablet Command. Using ArcGIS online tools you can customize how the data points are displayed.
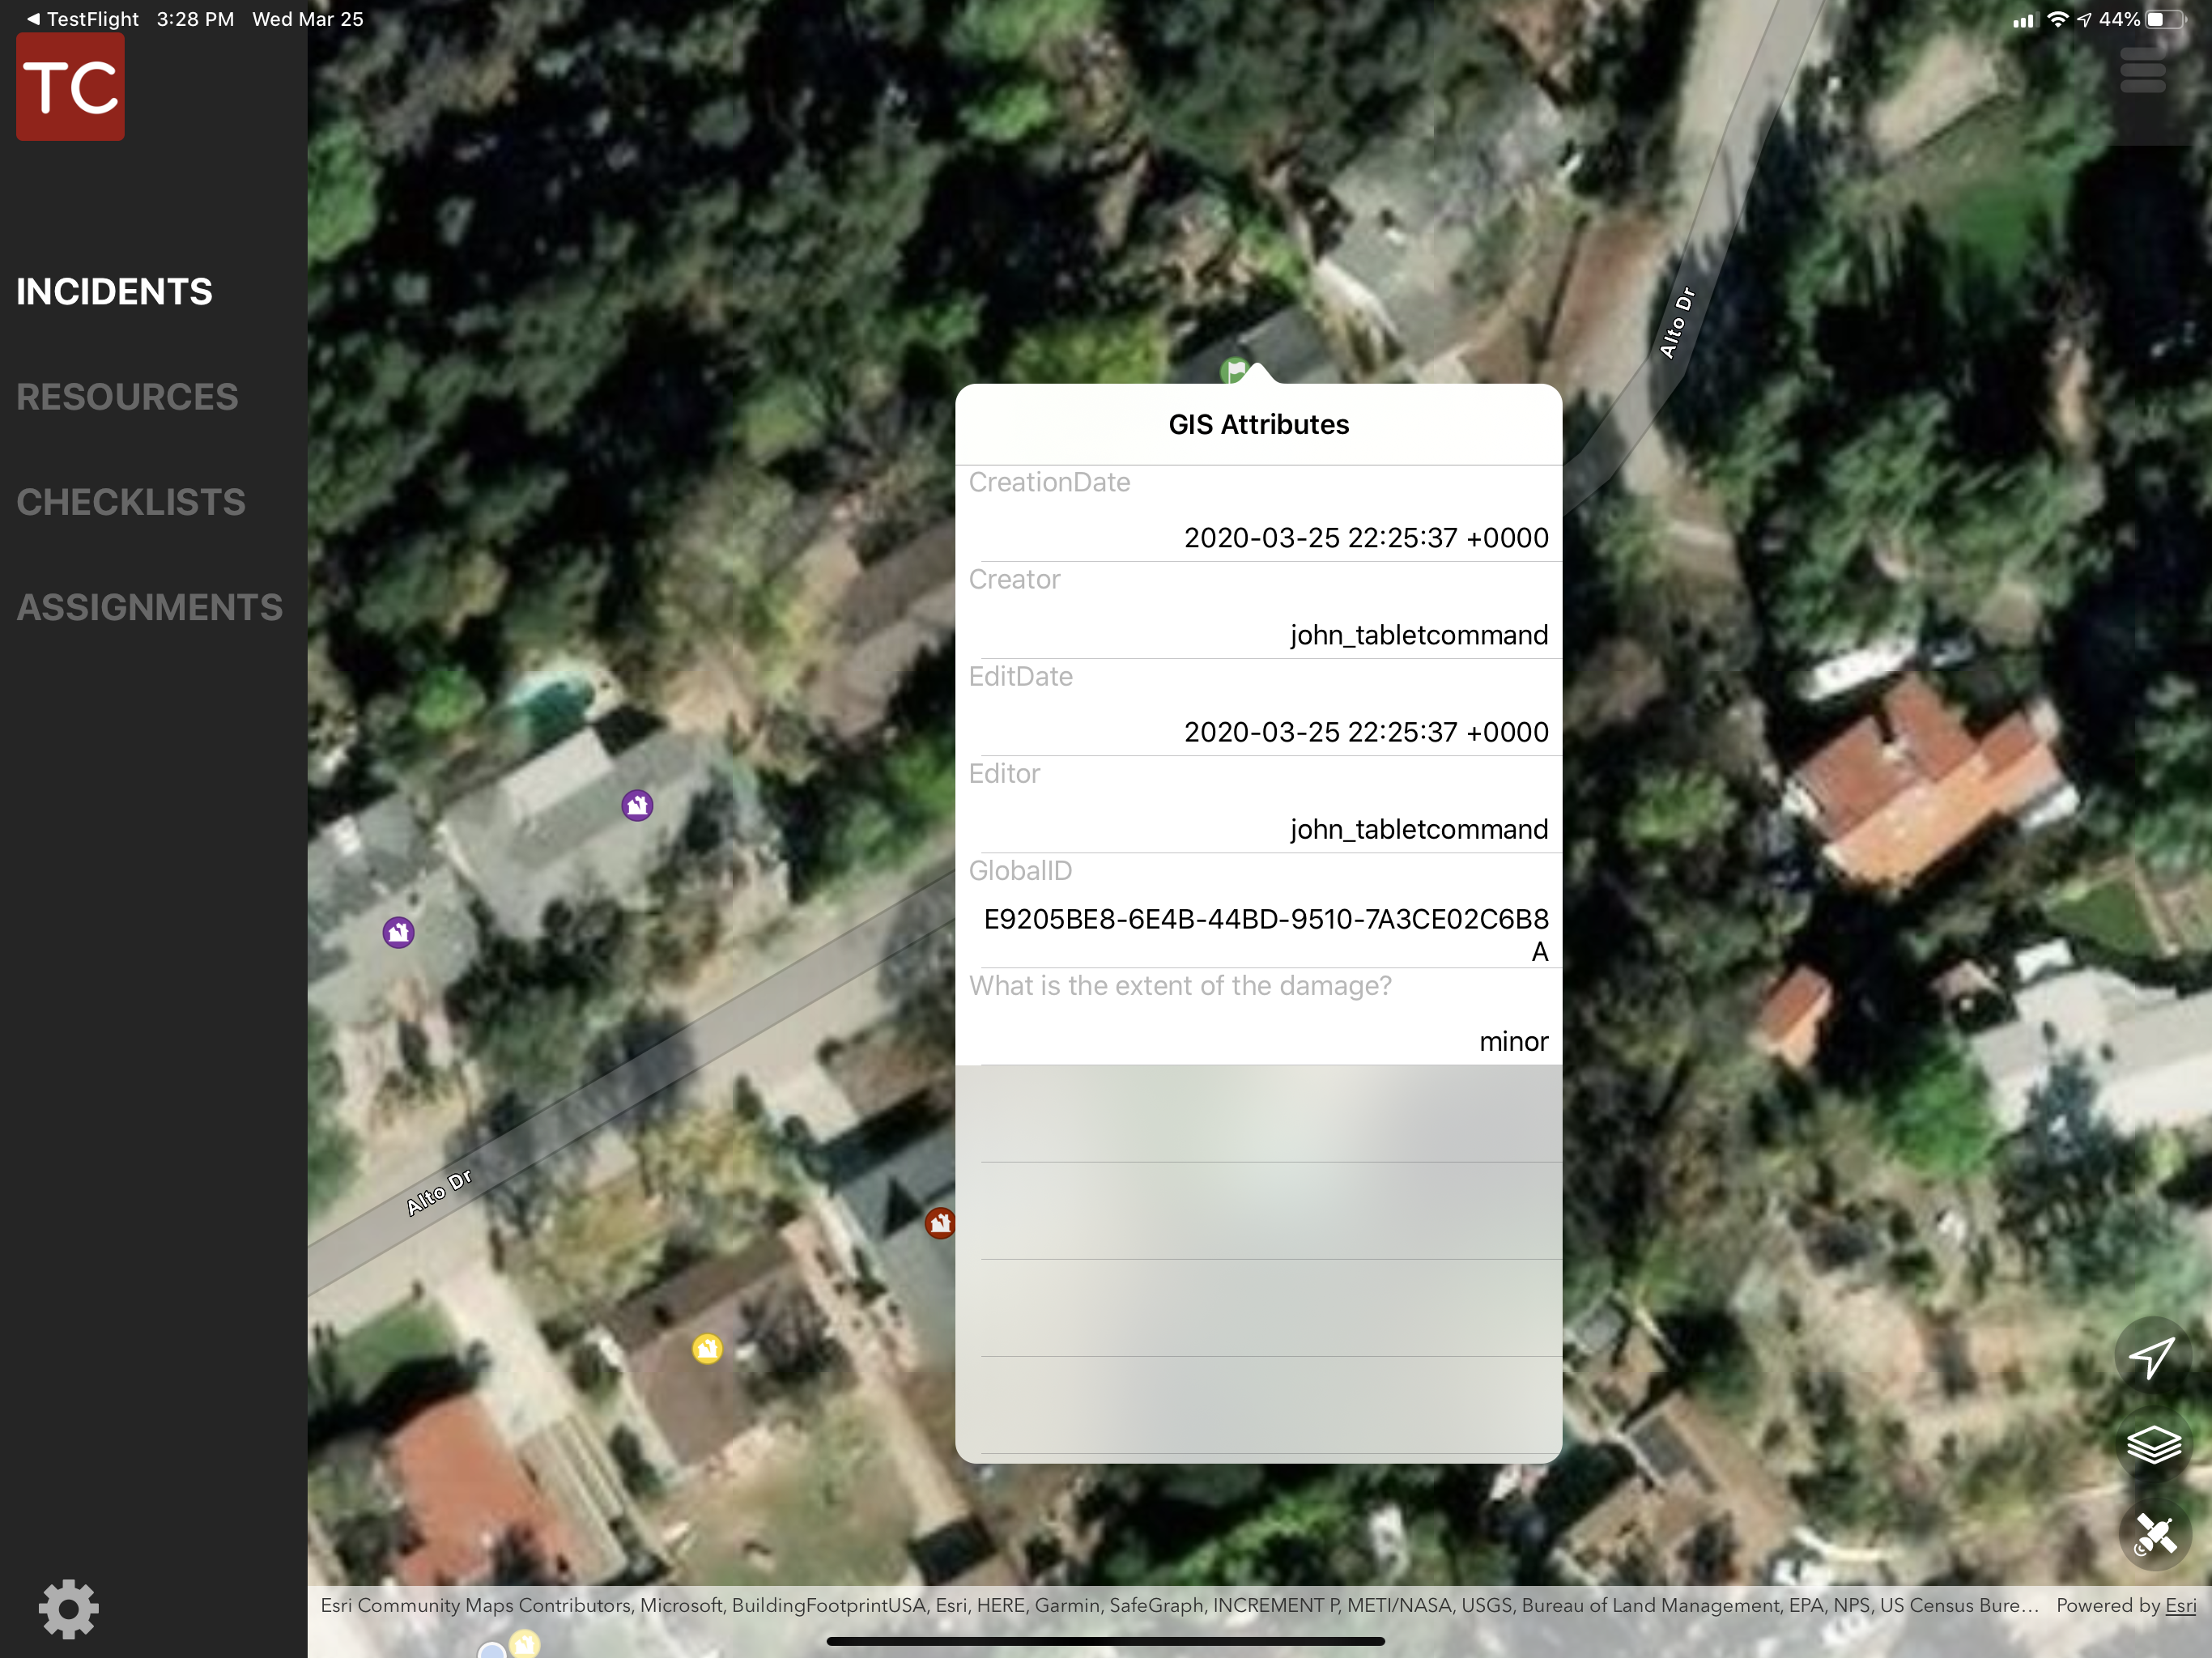
View in Tablet Command
Once a web map has been properly created field users will be able to access the data though the maps in Tablet Command. The answers to the questions are accessible by tapping on each of the locations. As surveys are being conducted the map in Tablet Command will update in near real time offering amazing shared situational awareness.